Farm Build a Graph – Interactive Picture Graph Activity

SMART Goal

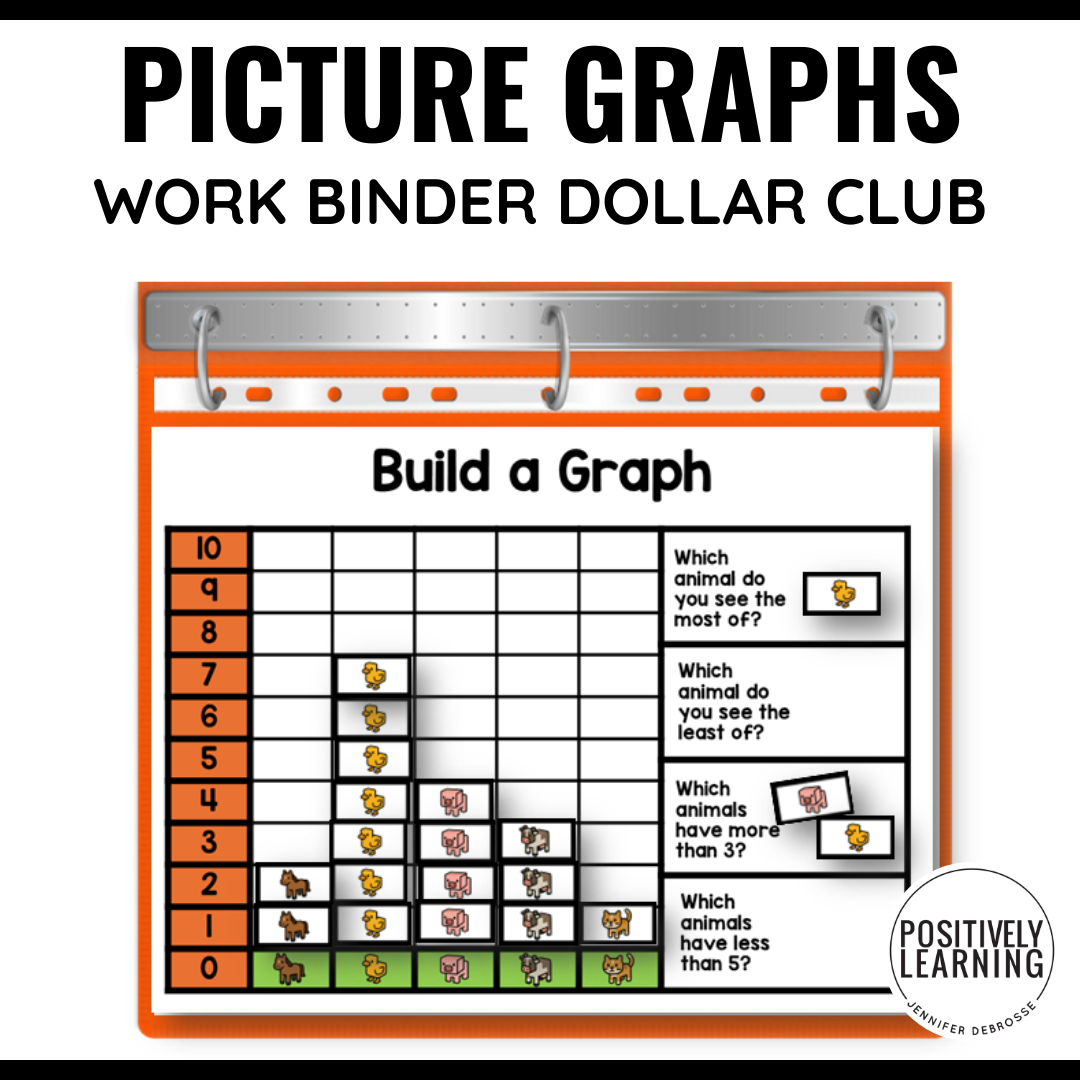
Given picture data and a blank graph template, the student will correctly create and interpret a picture graph by placing each item in the appropriate column with 80% accuracy across 3 consecutive sessions, as measured by teacher observation and work binder data.


Skills Targeted

  • Creating picture graphs
  • Interpreting data visually
  • One-to-one correspondence in graphing
  • Sorting and categorizing data
  • Comparing quantities (more, less, same)
  • Building early math data analysis skills
  • Increasing independence with math routines
  • Following step-by-step visual directions

People also downloaded:

0
    0
    Your Cart
    Your cart is empty

    Differentiation delivered to your inbox